- Key Takeaways
- How the Model Works: Three Rules
- The Four Percent Rule Does Not Shrink the Pile
- The Rebuilt Five-Fund Dividend ETF Portfolio
- Why DIV Lost the Accelerator Seat and DGRO Took It
- NOBL and SCHY: Stability and the International Wildcard
- What $500 to $1,000 a Month Builds, Year by Year
- The Deposit Matters More Than the Funds
- 2026 Account Limits and Dividend Taxes
- Stress Test: One Bad Year in Year Three
- The Five Risks to Watch
- Watch the Full Video Walkthrough
Can you really retire on dividends in 10 years starting with $0? The honest 2026 answer is more sobering than most videos admit. A plan of $500 a month, rising to $1,000 a month from year five, builds a dividend paycheck of about $350 a month by year ten. It does not build $3,000 a month. This article rebuilds last year's dividend retirement plan with today's yields, prices and dividend growth rates for SCHD, DGRO, NOBL, VNQ and SCHY, and shows exactly where last year's numbers went wrong.
Every figure below comes from a model built on published distribution history and Yahoo Finance prices. It is education, not financial advice, and past performance does not guarantee future results.
Key Takeaways
- $500 a month rising to $1,000 builds about $350 a month in dividends by year ten, not the $3,000 projected last year.
- Reaching $3,000 a month in dividends in ten years from zero takes about $6,400 a month going in, roughly $765,000 of your own money.
- DIV's payout per share fell by more than a third in ten years, so DGRO takes its seat as the real accelerator.
- The size of your monthly deposit matters far more than the fund lineup: the lineup moves the year-ten paycheck by about $50 a month, while the deposit moves it by hundreds.
- In a bad-year stress test, the rebuilt machine's year-ten income fell less than 1%, while last year's five funds fell about 7%, almost all of it from DIV.
How the Model Works: Three Rules
A projection is only as honest as its assumptions, so here they are. First, every fund starts at its trailing yield: what it actually paid over the last twelve months divided by today's price. Second, every fund's dividend keeps growing at its own measured pace. Where a fund has both a five-year and a ten-year growth rate, the model uses the lower of the two. Where a fund is too young to have five full years of history, it gets no growth at all. Third, share prices keep pace with dividends, so each yield stays where it is today.
Together, that works out to a total return of roughly 8.5% a year for the rebuilt machine and a little under 7% for last year's mix. That is a reasonable assumption, not a conservative one. Every dividend is reinvested and nothing is ever sold.
The Four Percent Rule Does Not Shrink the Pile
The best-known retirement target is the four percent rule: withdraw 4% of your savings in year one, then raise the withdrawal with inflation. For $36,000 a year, or $3,000 a month, that needs $900,000. Morningstar's latest retirement income research puts the safe starting rate at 3.9%, assuming a 30-year retirement, a 90% chance the money lasts, and a portfolio with only 30% to 50% in stocks. At 3.9%, the same $36,000 needs about $923,000.
Last year's video suggested dividend investing removes the need for a giant pile. That was not quite true. The rebuilt machine yields about 3% today, and at 3%, $36,000 a year needs about $1.2 million, more than the four percent rule requires.
What the dividend approach changes is how the pile pays you. Under the four percent rule you sell shares every month, and in a bad year you sell at the bottom. With a dividend machine you never sell: the companies send cash, the share count stays the same, and if dividends keep growing your paycheck gets a raise on its own. For a deeper look at when income can replace a salary, see our guide to the dividend crossover point.
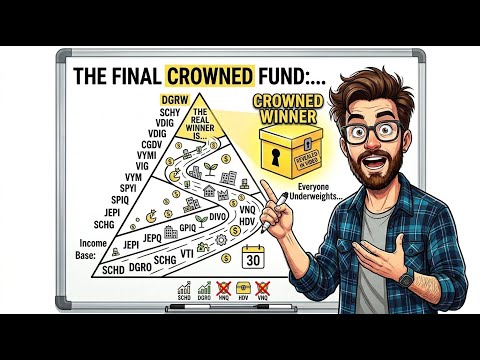
The Rebuilt Five-Fund Dividend ETF Portfolio
Here is the 2026 dividend ETF portfolio, one seat at a time, with the blended yield at about 3%.
- SCHD, 35%: the foundation.
- DGRO, 20%: the real accelerator.
- NOBL, 15%: stability.
- VNQ, 15%: real estate income.
- SCHY, 15%: the international wildcard.
Last year's mix, at today's prices, comes out to about 3.8% (last year's video quoted roughly 4.2%). The rebuilt machine starts with a smaller paycheck on purpose, in exchange for faster growth and fewer cuts.
SCHD: The Foundation
SCHD, the Schwab U.S. Dividend Equity fund, holds about a hundred large American companies screened for strong balance sheets, a long record of paying dividends, and dividend growth. It reshuffles once a year, every March, and costs 0.06% a year, or $6 on every $10,000. The trailing yield is about 3.2%, down from the 3.67% quoted last year mostly because the price rose.
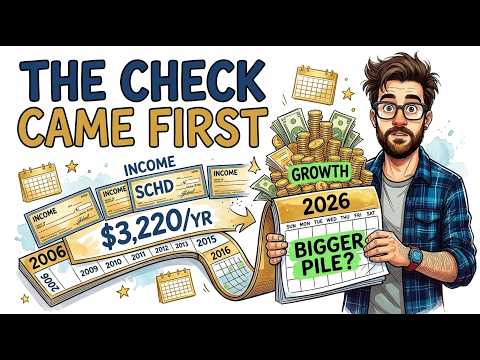
The key number is dividend growth: about 9% a year over five years and about 10.5% over ten. In 2015, one share (adjusted for its split) paid about 38 cents for the year. In 2025 the same share paid about $1.05, almost three times as much. At roughly $33 a share, a first $500 buys about 15 shares paying about $16 a year. Put $1,000 into SCHD on day one and it pays about $32 in year one, and in the model, with growth and reinvestment, over $100 a year by year ten. If you want to see how SCHD compares with a growth-tilted partner, read SCHD and SCHG: The 70/30 Core Satellite Strategy.
VNQ: Real Estate Income, in a Smaller Seat
VNQ, the Vanguard Real Estate fund, holds REITs such as Welltower and Prologis. Its trailing yield is about 3.8%, almost the same as last year's 3.82%. Its weak spot is growth: payout per share has grown only about 1% a year over both five and ten years.
One correction to last year: real estate did not hold up when SCHD struggled in 2022. VNQ lost about 26% with dividends included, while SCHD lost about 3%. Yet in that same year VNQ's payout per share rose about 9%, because the buildings kept collecting rent. Most of VNQ's income is taxed as ordinary income in a regular account, so it is best held in an IRA. Its seat shrinks from 25% to 15%.
Why DIV Lost the Accelerator Seat and DGRO Took It
DIV, the Global X SuperDividend U.S. fund, holds about 50 high-yielding, lower-volatility stocks such as Verizon, Altria, Pfizer and AT&T. Its trailing yield is about 6.7%. But in 2015 one share paid about $2.01, and in 2025 the same share paid about $1.26, a cut of more than a third. Measured over the decade, its payout shrank about 4.5% a year. In 2020, its worst year, the price fell about 29% and the payout fell about 26%.
A $1,000 deposit shows the problem. On day one DIV pays about $67 a year against SCHD's $32. But because DIV's per-share check keeps shrinking while SCHD's grows, the SCHD $1,000 pays more by year eight, and the gap widens from there. DIV is a head start that shrinks, which suits someone who needs income today but not a ten-year build.
The real accelerator is a fast-growing dividend. DGRO, the iShares Core Dividend Growth fund, yields only about 1.9% and costs 0.08%, but its dividend grew about 7% a year over five years and about 8.4% over ten. In 2022, DGRO's price fell about 10% while its payout per share rose about 9%. DGRO takes 20% of every deposit. VIG is a similar alternative, yielding about 1.5% at a 0.04% cost. For a head-to-head comparison, see DGRO vs SCHD.
DIVO, the Amplify Enhanced Dividend Income fund, sells call options for extra income and should be judged by distribution rate, which annualizes to just under 5% on its latest monthly payment. Screeners show closer to 6.5% because last December's payment was about 95 cents a share, several times its usual check. It is better suited to the finish line than to a ten-year build.
NOBL and SCHY: Stability and the International Wildcard
NOBL, the ProShares S&P 500 Dividend Aristocrats fund, holds equal amounts of companies that have raised dividends for at least 25 years. Its trailing yield is about 2.2% and its cost is 0.35%, the highest in the machine. Its ten-year dividend growth, measured again this week, is about 8.4% (last year's video said 8.84%), and about 5.5% over five years. In 2022 its own payout per share dipped about 6% while its price fell about 8%, a reminder that a fund is not the same as the companies inside it. It keeps its 15% for stability, not yield.
Last year's wildcard, NUDV, loses its seat. The 108% one-year dividend growth quoted last year came from one unusually large payment at the end of 2024, and it was never real growth. Its trailing yield today is a little over 2%, not 5.47%.
SCHY, the Schwab International Dividend Equity fund, takes the seat. It yields about 3.7%, costs 0.08%, and returned about 34% in 2025. Its checks are uneven, with a March payment of about 18 cents and a June payment of about 36 cents, which is normal for international dividends. With fewer than five years of history it gets no growth in the model, so any growth is a bonus.
What $500 to $1,000 a Month Builds, Year by Year
Picture someone who is 45 with nothing invested, investing $500 a month for four years and then $1,000 a month from year five through year ten. That is $96,000 of their own money.
- Year 1: $6,000 invested; income pace about $190 a year, or $16 a month.
- Year 3: $18,000 invested; about $610 a year, or $50 a month.
- Year 5: $36,000 invested; about $1,300 a year, a little over $100 a month.
- Year 7: $60,000 invested; about $2,300 a year, around $190 a month.
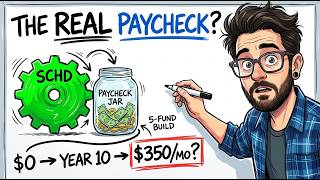
- Year 10: $96,000 invested; the machine is worth about $143,000 and pays about $4,200 a year, or about $350 a month.
Last year's video claimed $35,000 a year and an $830,000 portfolio. With only $96,000 invested, that would have required a return above 40% a year. No dividend fund does that.
As a reality check, last year's five funds reach about $400 a month by year ten in the same model. Started for real in October 2016 with those funds, using actual prices and payouts, the plan would be paying about $450 a month today. The real decade lands next to the model.
Why rebuild, then? The rebuilt machine is worth about $10,000 more at year ten, its income comes from growing dividends instead of shrinking ones, and if you stop adding money at year ten, it passes the old machine's income in year nineteen. Still, the lineup changes the year-ten paycheck by only about $50 a month.
The Deposit Matters More Than the Funds
A flat $500 a month for ten years yields about $235 a month at the finish. The $500-then-$1,000 plan yields about $350. Adding $100 to the monthly deposit every year yields about $415. Starting at $1,000 a month and raising it 10% each year gives about $700 a month by year ten. The funds are the gears; the deposit is the engine.
So what does it take to reach $3,000 a month in dividends in ten years? With the rebuilt machine, about $6,400 a month for ten years, or about $765,000 of your own money, ending with a portfolio worth about $1.2 million paying about $36,000 a year. Last year's higher-yielding mix needs about $5,600 a month, in exchange for a smaller, more fragile machine. For a $1,000 monthly target you need about $2,100 a month going in, and for $2,000, about $4,250.
You can also trade money for time. At a flat $1,000 a month the model reaches $3,000 a month in about 26 years. At $2,000 a month it takes about 20 years, and at $3,000 a month about 16. Ten years from zero is possible, but only for someone who can invest several thousand dollars a month. If you are exploring accelerated timelines, the dividend bridge strategy is a useful companion read.
2026 Account Limits and Dividend Taxes
In 2026 you can put $7,500 into an IRA, plus $1,100 more if you are 50 or older. A 401(k) takes up to $24,500, with an $8,000 catch-up at 50 and an $11,250 catch-up from ages 60 to 63. Last year's plan fits entirely in an IRA for years one to four ($6,000 a year); from year five, $12,000 a year means the first $7,500 fits and the rest goes to a workplace plan or taxable brokerage account.
VNQ belongs inside the IRA because its income is mostly taxed like a paycheck in a regular account. The law signed in July 2025 made the 20% deduction on REIT dividends permanent, but a sheltered account still beats a deduction. SCHD and DGRO mostly pay qualified dividends, which get lower tax rates. In 2026, a married couple with taxable income up to $98,900 pays 0% federal tax on them; for a single filer the line is $49,450. A couple maxing out two 401(k)s and two IRAs could shelter $64,000, while the $6,400-a-month plan is about $77,000 a year, so even they would spill into a taxable account.
Stress Test: One Bad Year in Year Three
The model took each fund's own worst calendar year since 2016, with its real price drop and real payout change, and applied all of them at once in year three. VNQ drops about 29%; DIV drops 29% and cuts its payout by about a quarter; NOBL drops 8% and trims its payout about 6%. Prices then climb back over two years, and any payout cut stays cut.
Last year's five funds ended year ten with income about 7% lower, roughly $350 a year, and DIV alone caused almost all of it. The rebuilt machine finished less than 1% lower, about $15 a year. Portfolio value at year ten was slightly higher after the crash for both, because a falling price with a steady dividend means every deposit and reinvested check buys more shares. A crash does not break a dividend machine; a dividend cut does. One limit: the years since 2016 contain nothing like 2008, and a longer, deeper bear market with cuts across the board would hurt both machines more. Related reading: the cost of pausing dividend ETFs.
The Five Risks to Watch
- Dividend cuts: DIV cut in 2020 and NOBL's payout dipped in 2022. No fund is immune.
- Growth rates may not hold: if every dividend grows only half as fast as assumed, the rebuilt machine reaches about $310 a month at year ten instead of $350.
- Interest-rate sensitivity: real estate is rate-sensitive and VNQ's check has barely grown in a decade.
- Taxes: in a regular account every dividend is taxed in the year it arrives, even when reinvested.
- Forced selling: keep a few months of expenses outside the machine, for example in SGOV, a Treasury bill fund yielding about 3.7% today.
The biggest risk is the deposit itself: every number here moved most when the monthly amount moved.
Watch the Full Video Walkthrough
For a visual, year-by-year walkthrough of the model, watch the full video, How I'd Retire On Dividends In 10 Years Starting With $0 - The 2026 Math, on Harry's Financial Fitness. To work the $3,000 target backwards, watch the follow-up, The SCHD Retirement Calculator. Tell us in the comments: what is your monthly dividend target, and how many years are you giving yourself?
Disclaimer: This is not financial advice. Every figure is a model built on published history. Always do your own research. Past performance does not guarantee future results.