Dividend ETF Income in Every Crash Since 2008: What Really Happened
Dividend ETFs fell by half in 2008, but their income cut came in 2009. See what VIG, VYM, DVY and SCHD paid through every crash since.
Read More
In-depth articles on investing, ETFs, passive income, and wealth building strategies

Dividend ETFs fell by half in 2008, but their income cut came in 2009. See what VIG, VYM, DVY and SCHD paid through every crash since.
Read More
On $500 a month, 1,000 shares of SCHD take about 5 years 8 months and pay about $88 a month. Here's the full timeline, history and paycheck math.
Read More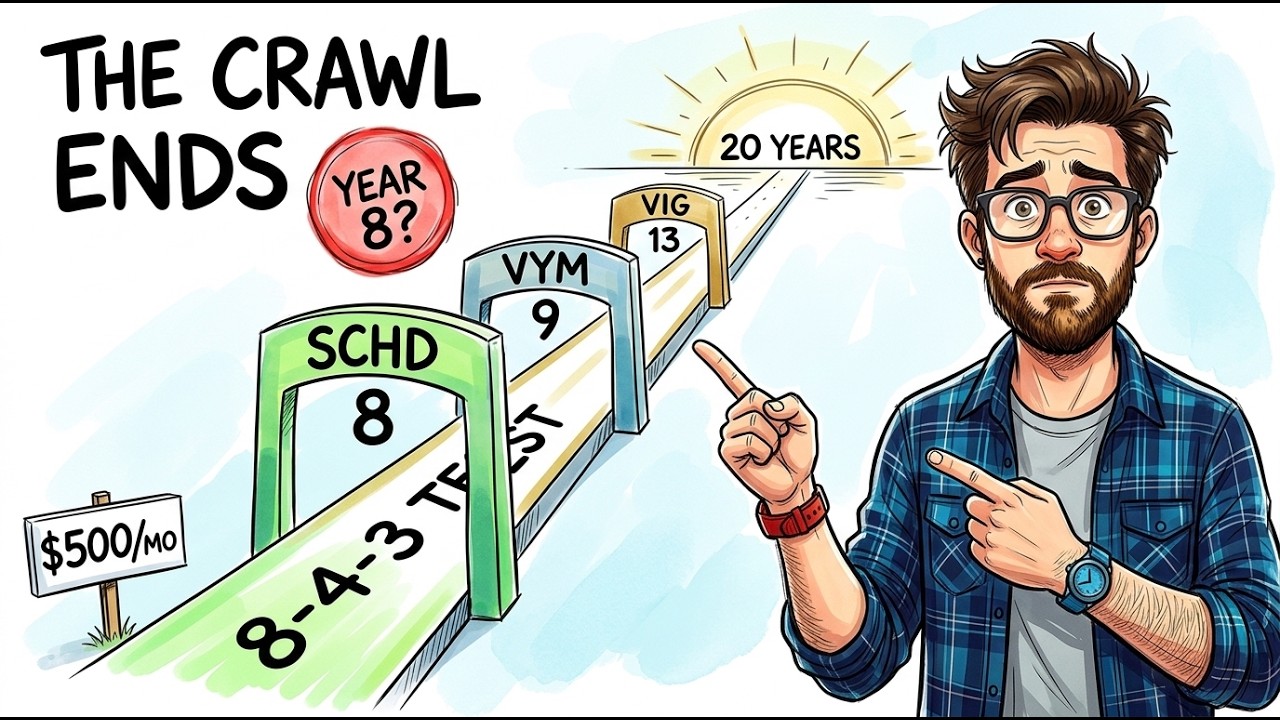
We ran 20 years of VIG, VYM and SCHD data through the 8-4-3 rule at $500 a month to find the year dividend income actually takes off.
Read More
A ten-year back test prices 12 dividend ETF mistakes on a modelled $100,000, from a $170 ex-dividend slip to a $136,000 panic sale.
Read More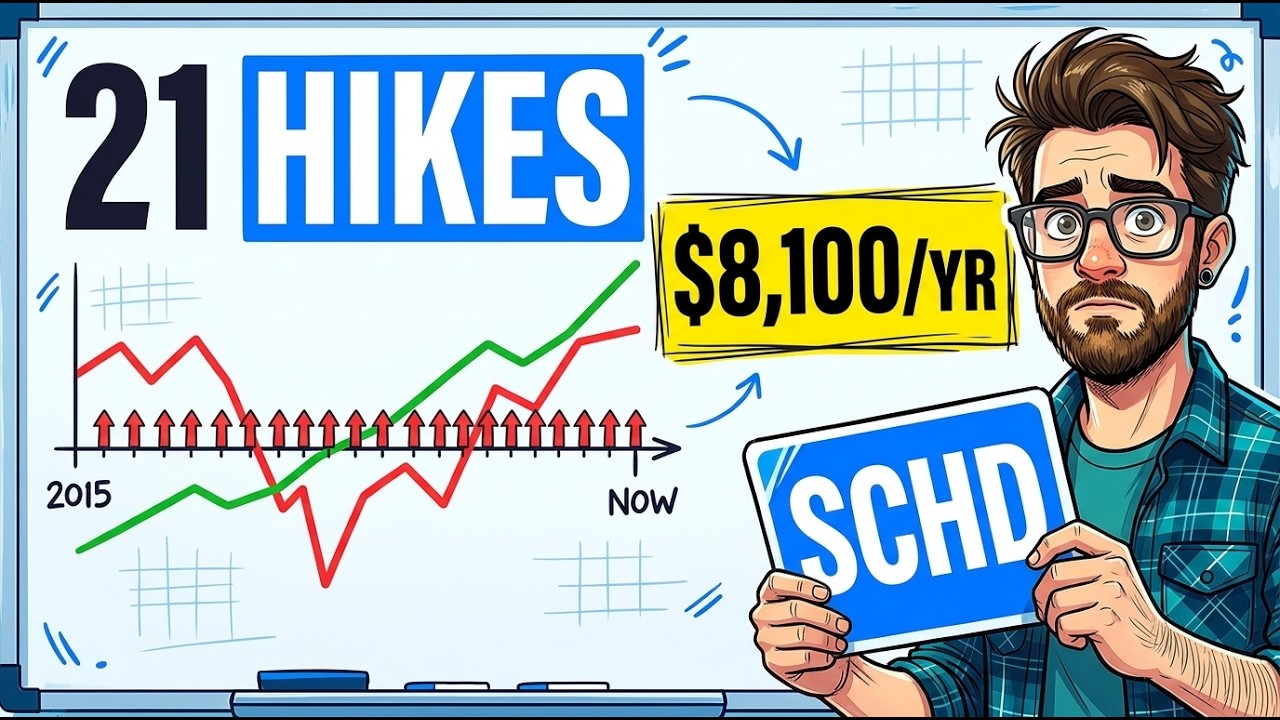
A modelled $100K in SCHD since 2015 now pays $8,100/year through 21 Fed hikes — here's what the price and dividend history actually show.
Read More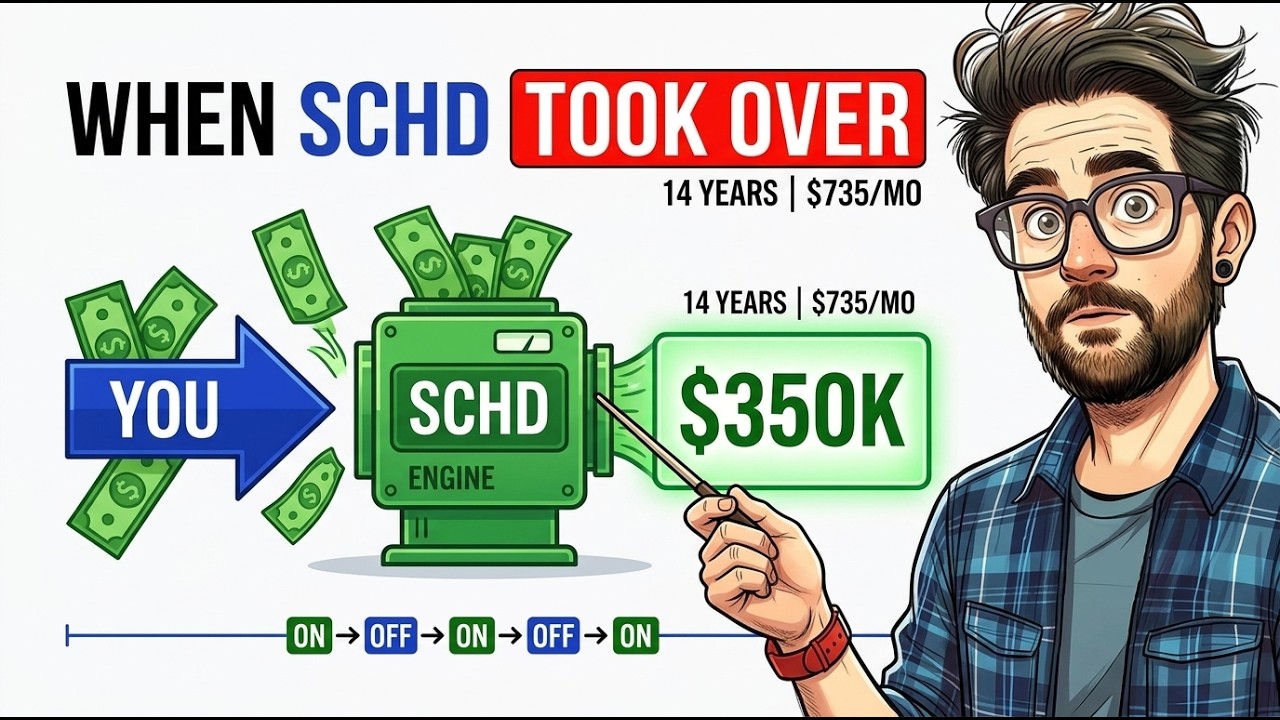
A 14-year SCHD/VOO model shows the dividend crossover point hit in 2017 at $67,100 — then reversed twice before settling in.
Read More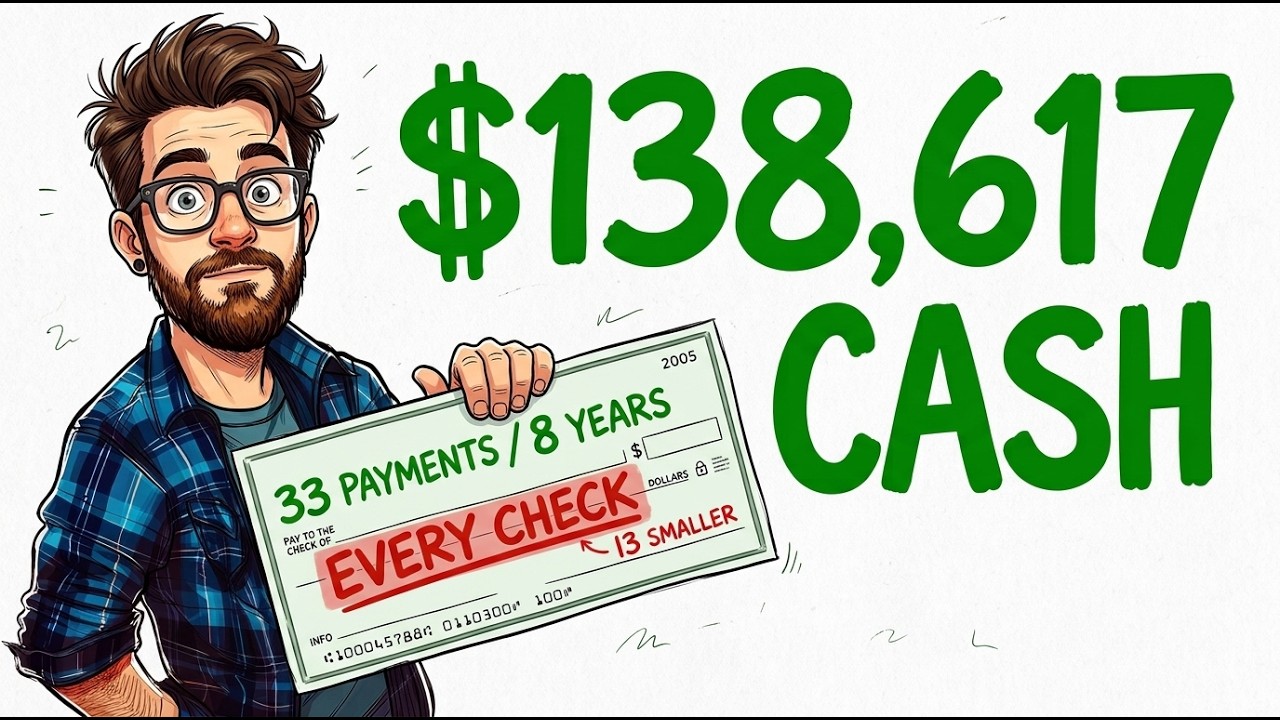
A real, payment-by-payment ledger of $500,000 split into VYM, DGRO and VIG since 2018 — including the 13 quarters that fell.
Read More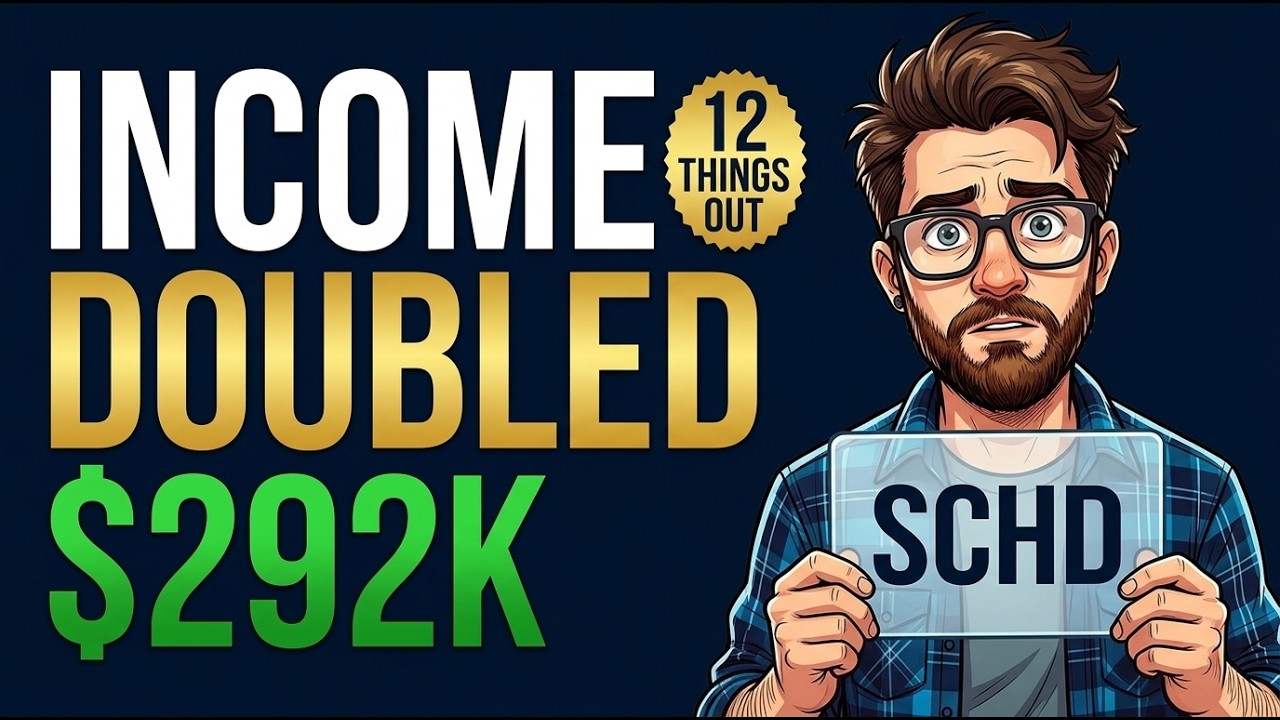
Twelve things stopped, not started, more than doubled modelled dividend income over 11 years — with the sourced numbers behind each one.
Read More
SCHD's yield fell below Treasury bills in 2026, but 14 years of rising dividends tell a very different story than the headlines.
Read More